The importance of Monthly Recurring Revenue has been on the steady rise over the recent years. We are witnessing new companies springing up like mushrooms on the web hosting market, and to noone’s surprise, a vast majority of them have opted for a subscription-based business model. That means the need for analyzing the monthly income and future budget has also popped up.
Armed with the basic know-how of what MRR is and how to calculate it, you already can put together a general picture of how well your WHMCS business is performing financially. But as your subscription base continues to change over time, with new clients signing up and existing ones churning, your MRR will enter the state of upward and downward flux. It will thus become imperative to track not only the plain figures behind your recurring revenue, but also recognize the factors that make up the trends and changes it goes through.
That’s when MRR Breakdown should be put into routine use.
MRR Breakdown – Your income under the microscope
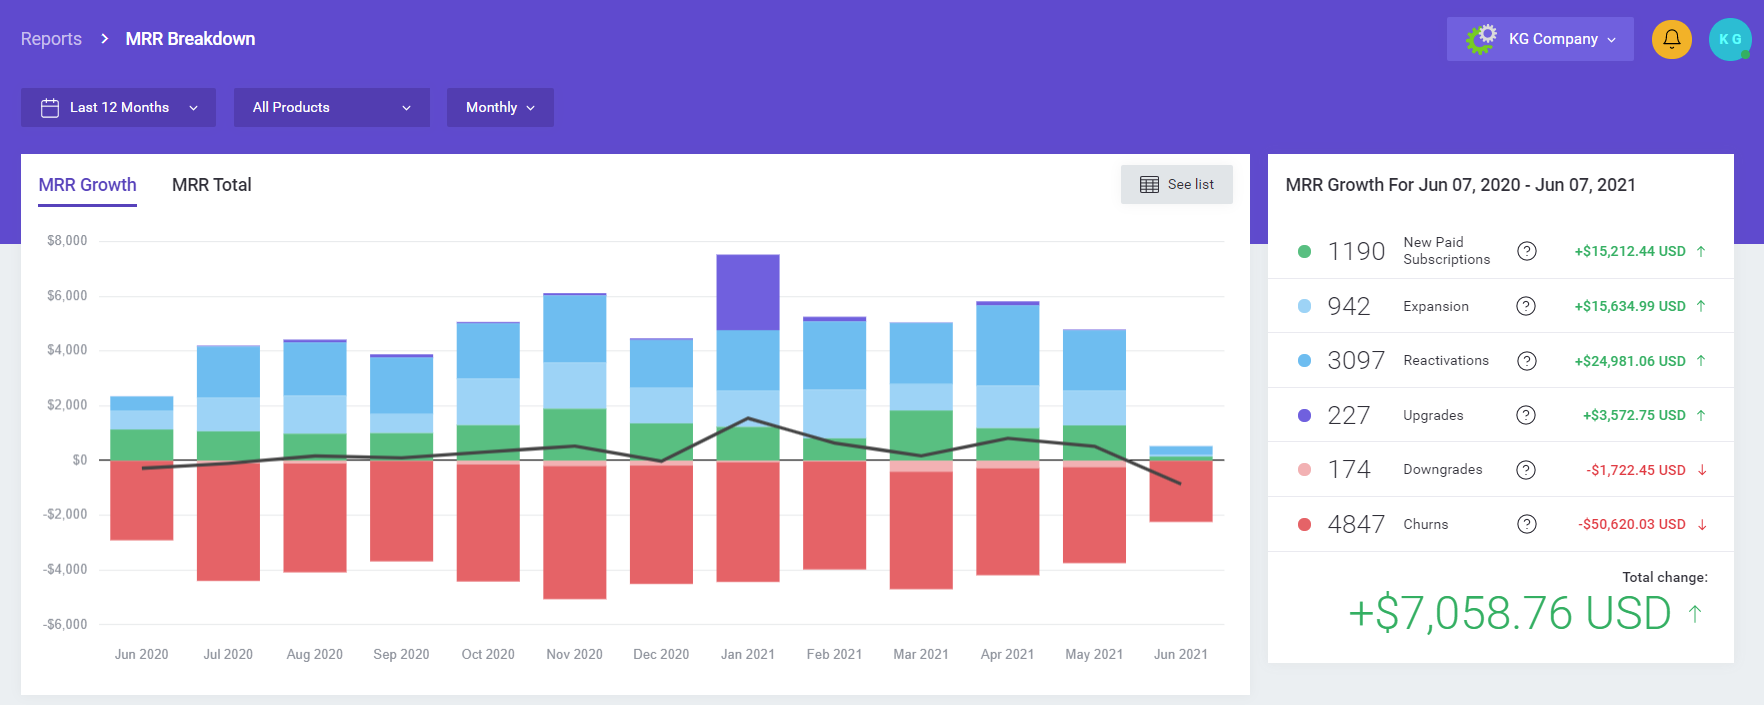
One look at MetricsCube’s brand-new section is enough to understand that MRR, although seemingly straightforward, is actually quite a layered metric that can be used in a myriad of ways for in-depth business analysis.
Start exploring the nooks and crannies of your revenue by looking at MRR Growth that visualizes shifts in your monthly earnings from all or selected products, and within a specified period of time – all this in an easily digestible graph form. Make sure the trend line gets close attention in your business monitoring regime – it will give you a clear understanding of the sustainability and the general direction your company is heading profit-wise.
Looking for a more complex insight? You have the MRR Total graph right at hand as well to include two more types of MRR streams into the calculations: renewals and amortized MRR, which represents subscriptions that were paid for in the past while still counting as MRR during the analyzed period.
Example:
If a customer pays $240 for a yearly service in January, the amount will be divided by 12 and reported in MRR Total on a monthly basis as $20 until December.
In addition, you can track the numbers behind each component of your monthly revenue, such as upgrades, expansions and churns, summed up for the whole period you are currently looking into.
The segment with general statistics starts with a super convenient comparison between your monthly earnings on a chosen day, and those generated one, three, six and twelve months earlier. Looking backward at how your recurring revenue performance was trending throughout the past year is crucial for predicting future cash flows and setting achievable goals.
You can drill down on MRR even further with the set of graphs (convertible to lists) that categorize your income by the type, product, product group, as well as the country. Should I focus marketing efforts primarily on cloud hosting services? Will it be a good idea to branch out further into the European market? Once you gain the knowledge of what products make your MRR soar, and from where the customers behind the most of your profit are, mapping out the game plan that will help your business scale will become less of a guess and more of an educated decision.
Two more key metrics in MetricsCube portfolio
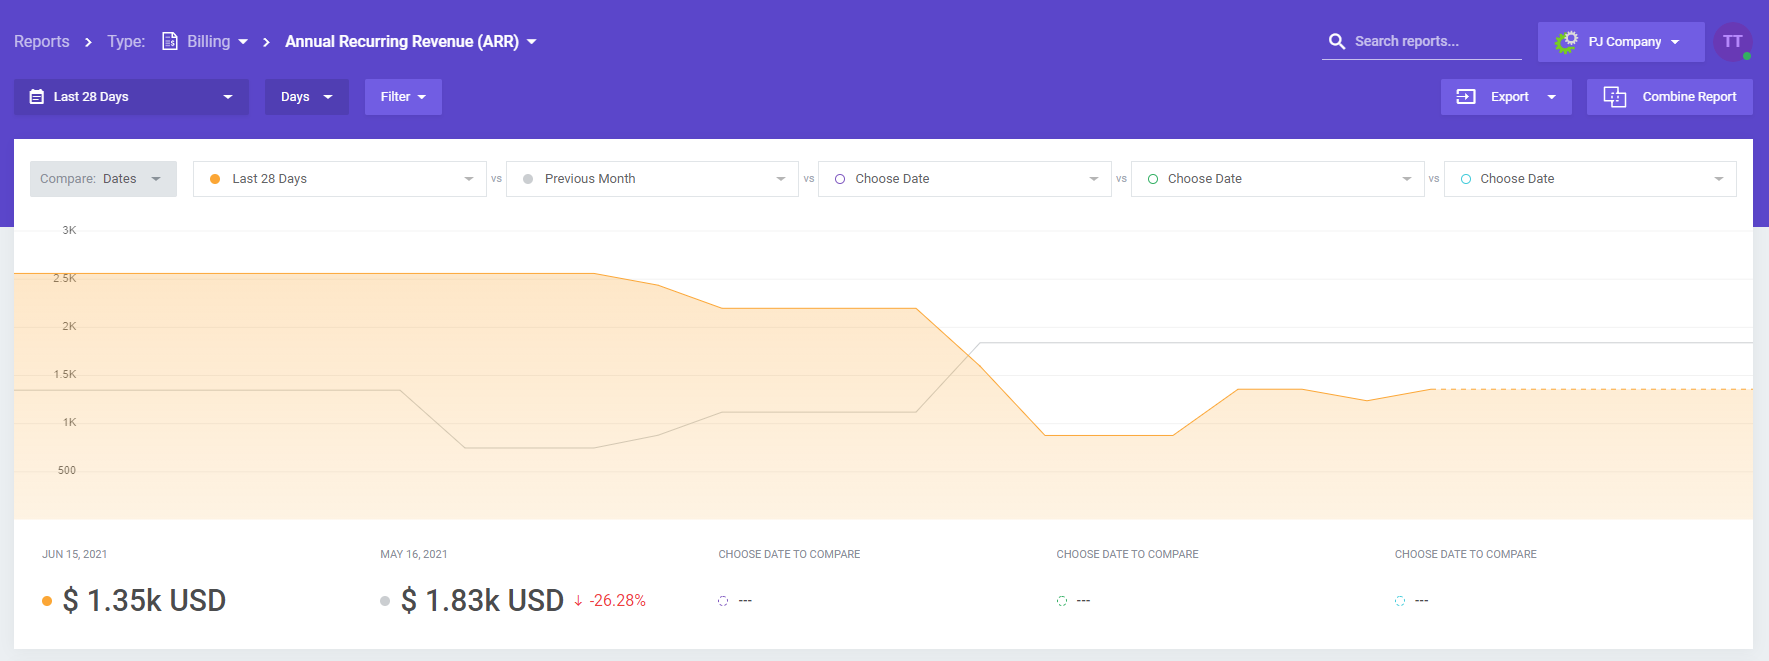
MRR Breakdown is an undoubted show-stopper, but don’t let it rivet all your attention – the latest roll-out features the premiere of two brand-new billing reports that deserve a spotlight as well! Annual Recurring Revenue – as we are sure you have guessed – is simply the annualized version of MRR representing the income generated by your customers over the course of a year. By projecting a bigger picture of your recurring revenue, the ARR report will lead to stronger budget forecasting, and help you make proactive financial moves.
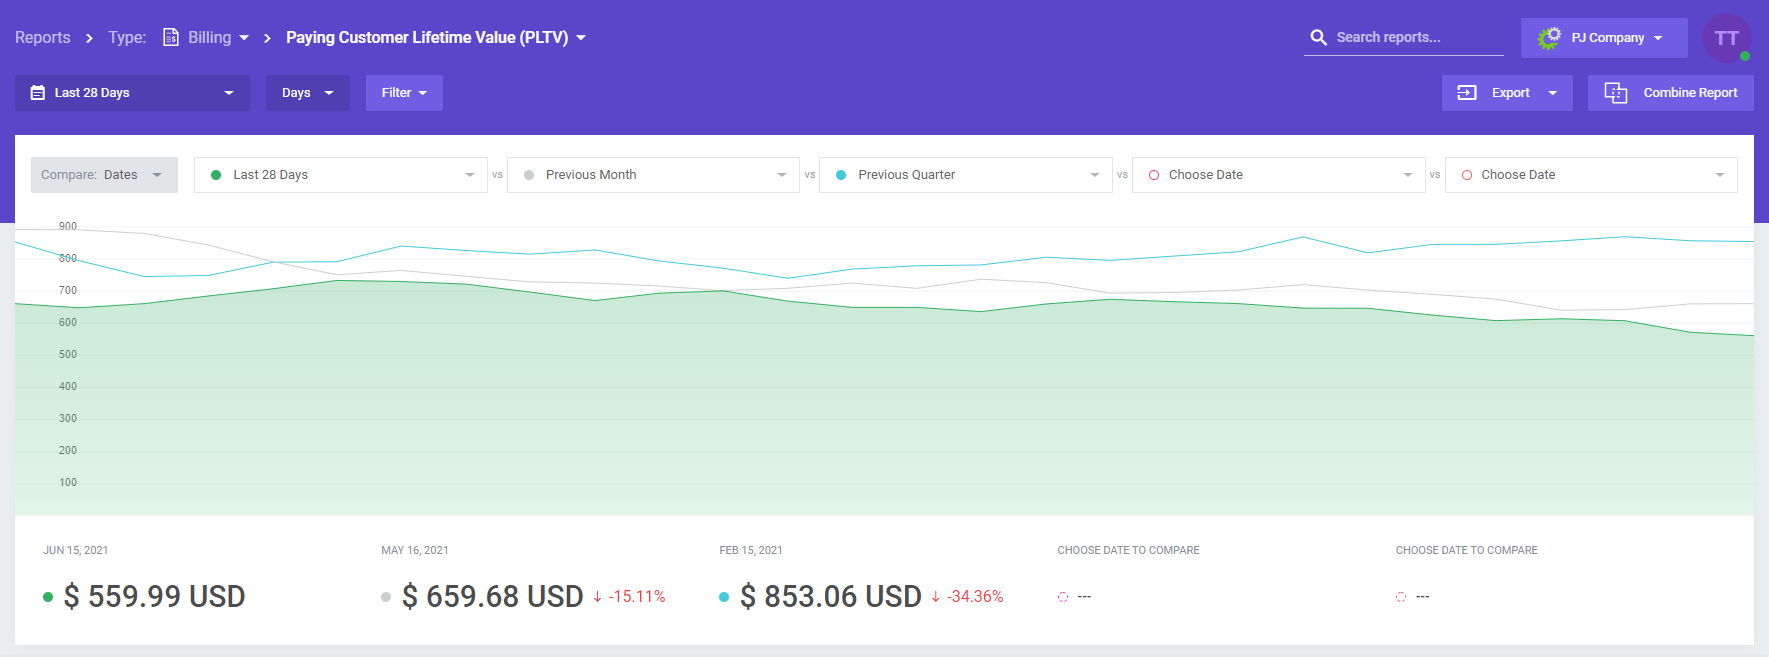
The second metric understandably brought to the fore is Paying Customer Lifetime Value which clues you into how much money a customer is expected to spend at your website throughout their entire time as your paying customer. Finding your PCLV will stretch your thinking beyond a narrow focus on the one-off sales to a broader perspective on the full customer journey. Add to that the eye-opening fact that customer acquisition has been proven to cost five times more than retention, and you will not fail to realize why PCLV is such a big deal.
See? There are so many doors yet to open when it comes to your revenue, and the more of them you actually go through, the more efficiently you will be able to identify the health of your company. Now that you have learnt the best way to do it, shall we get down to calculating, measuring and tracking?
You will gain exclusive access to the MRR Breakdown section if you own “Business” or any higher pricing model. MRR Breakdown is the first of many premium reports that we are going to introduce with our attractive new billing system that features plan upgrades to let you easily adjust MetricsCube to your needs and wallet. Check for yourself!


