


In the web hosting industry, numbers don’t lie – but sometimes they do mumble. You might have revenue data here, churn stats there, and MRR details buried under a few clicks. Sound familiar? That’s why we’ve decided to pull it all together and give you one clear, unified picture of how your business is really doing.
We’re stepping beyond the usual metrics overview with a major update to MetricsCube – a brand-new Performance Report, freshly added to our collection of premium datasets.
The big picture in one place
With the new Performance Report, we’re making it easier than ever to keep a finger on the pulse of your business. And we don’t just mean part of it – we mean the whole company. Whether you’re in charge of growth strategies, forecasting, or simply need to report upstream, this tool was built to provide a clearer view.
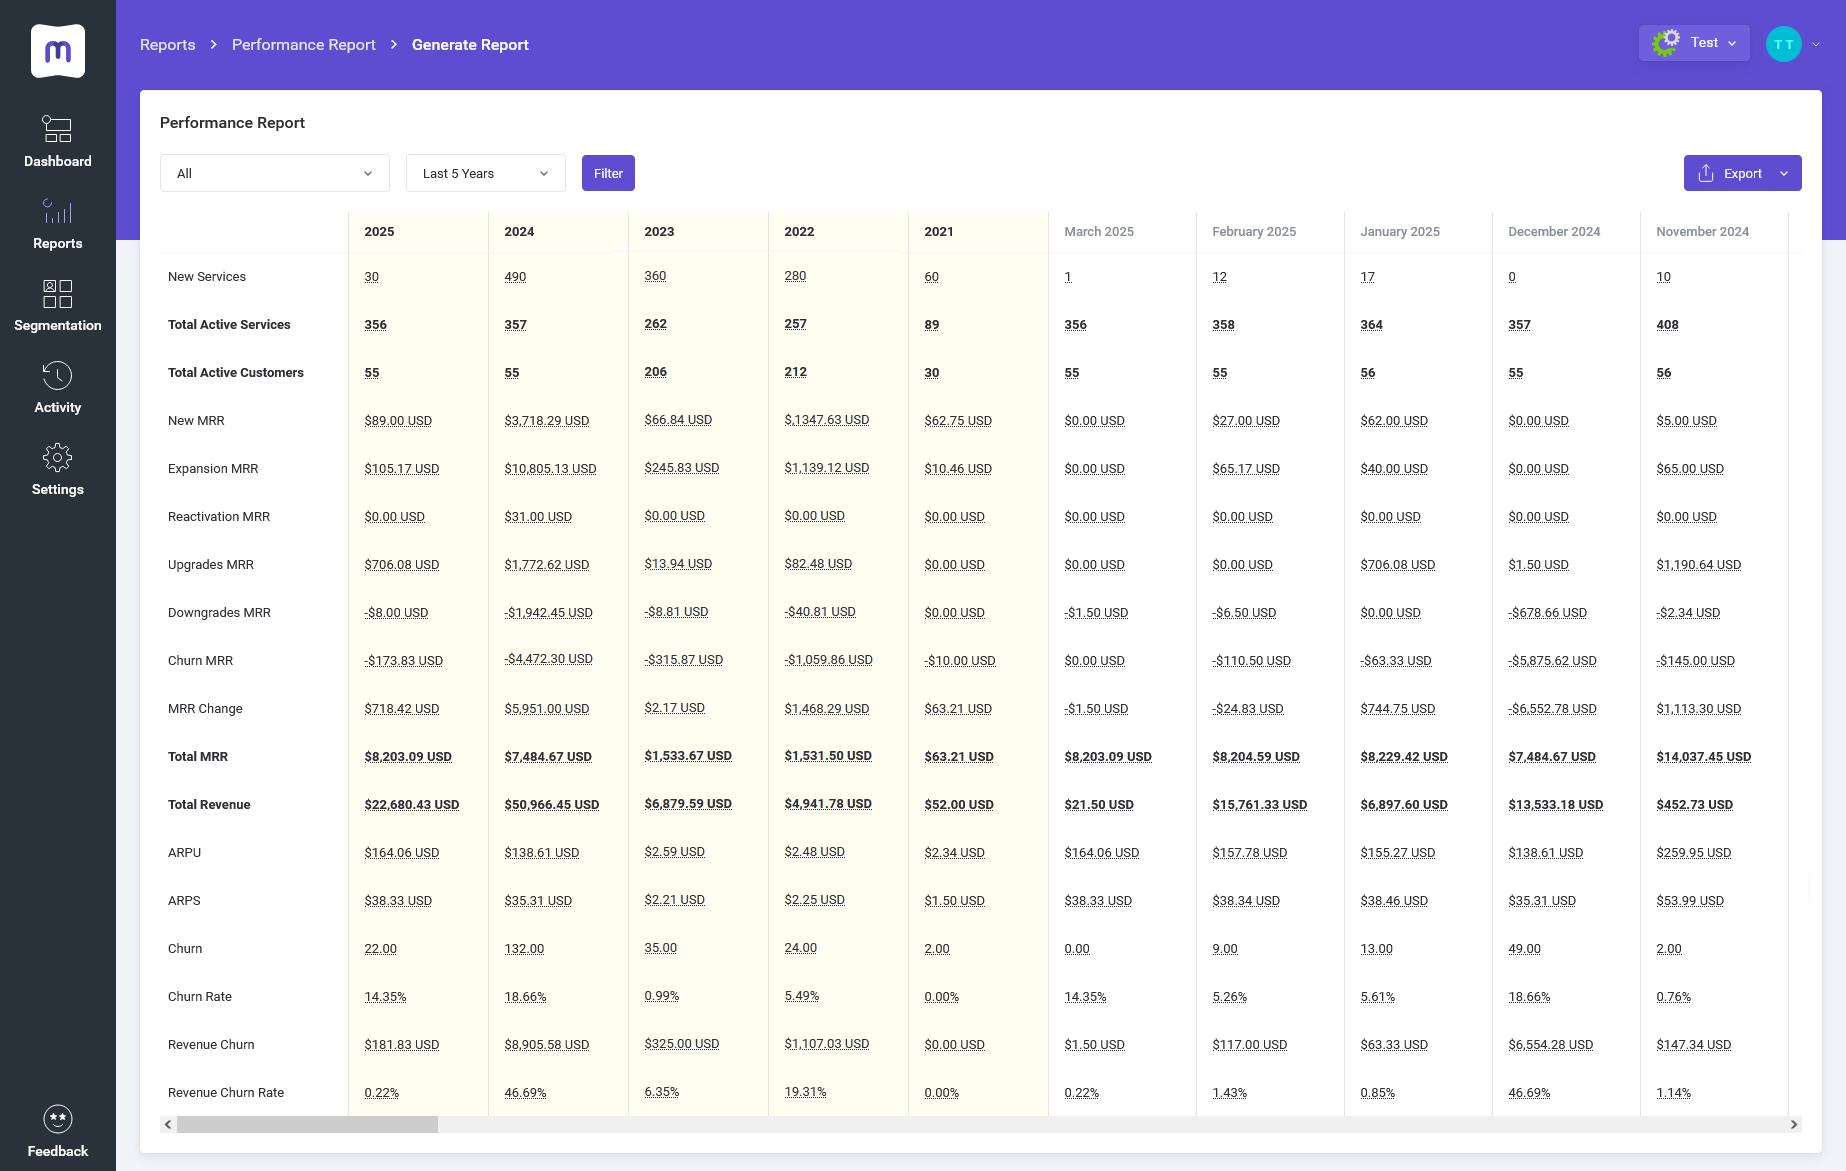
Here’s a carefully organized set of key metrics you’ll now have at your fingertips:
- New Services
- Total Active Services
- Total Active Customers
- Total MRR (Monthly Recurring Revenue) – segmented into essential layers like New, Expansion, Reactivation, Upgrades, Downgrades, Churn and the overall MRR Change
- Total Revenue
- ARPU (Average Revenue Per User)
- ARPS (Average Revenue Per Service)
- Churns
What makes it even more practical? Besides the usual month-by-month view, you can check each data point via two additional timeframes: a 2-year scope covering the current and previous year, or a 5-year scope that includes the current year plus the past four years. So whether you need to dive into detailed monthly snapshots or look at more long-term trends, the report is flexible enough to suit your needs.
Built for easy navigation
We know how important structure is when you’re handling this much data. That’s why the report is divided into six sections that help you make sense of it all, fast:
- All – a full overview across all services
- All Products – with splits by products, domains, and addons
- Products per Product
- Products per Group
- Domains per TLD
- Product Addons per Addon
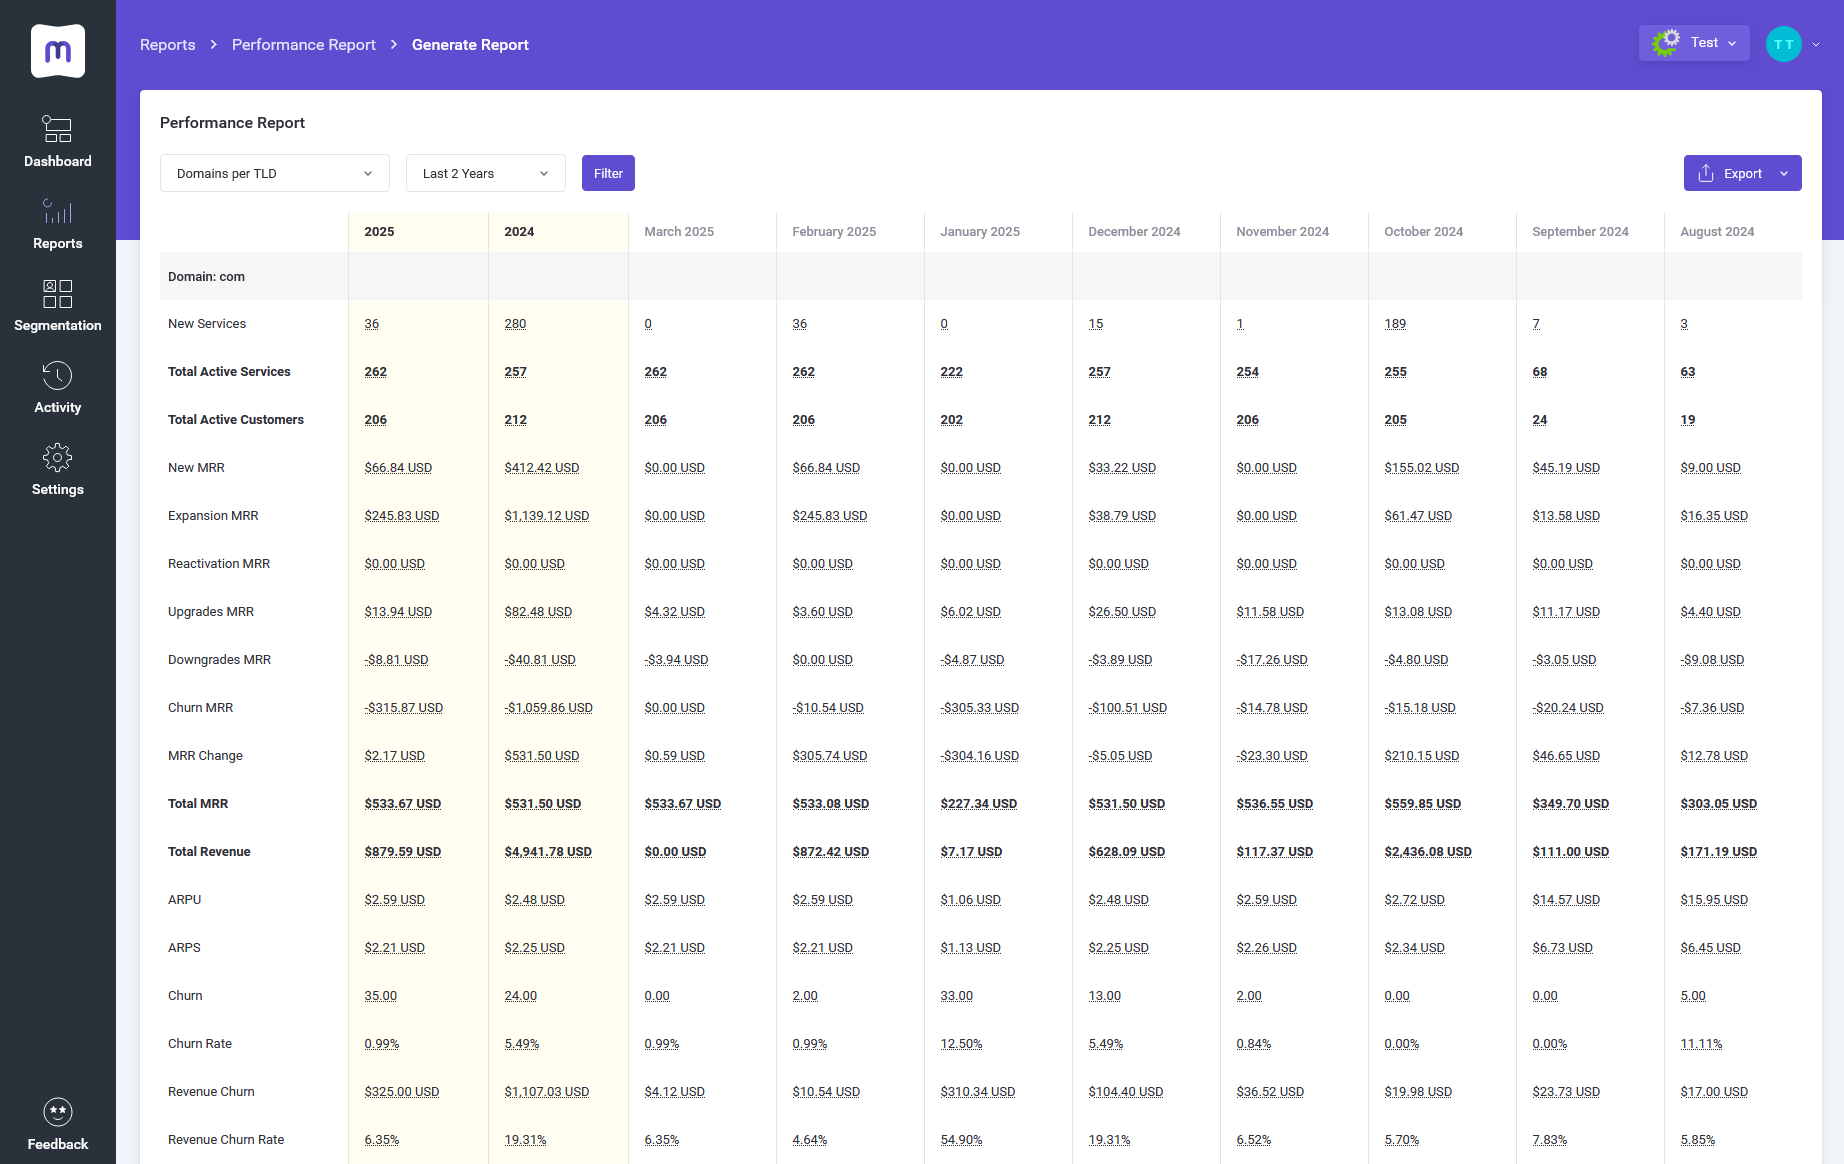
But it’s not just about that first glance – it’s about being able to follow the data trail. That’s why we’ve made the Performance Report interactive. Clicking on a value takes you deeper, straight to a relevant report inside MetricsCube, already pre-filtered for context.
☞ Here’s an example of how it works:
Let’s say you’re going through a report with the Products per Product filter turned on, and one product’s Total Revenue in January 2025 catches your eye. One click on that figure, and you’re automatically taken to the full Revenue report under Billing, already set to display data for that specific product across January and the previous month.
Once you’ve analyzed the data, sharing the findings or taking them offline is effortless. You can export the report details in CSV, XLS, or PDF formats to collaborate easily with your teams, perform deeper analysis using external tools, and automate your reporting routines to save precious hours.
Wait, there’s even more?
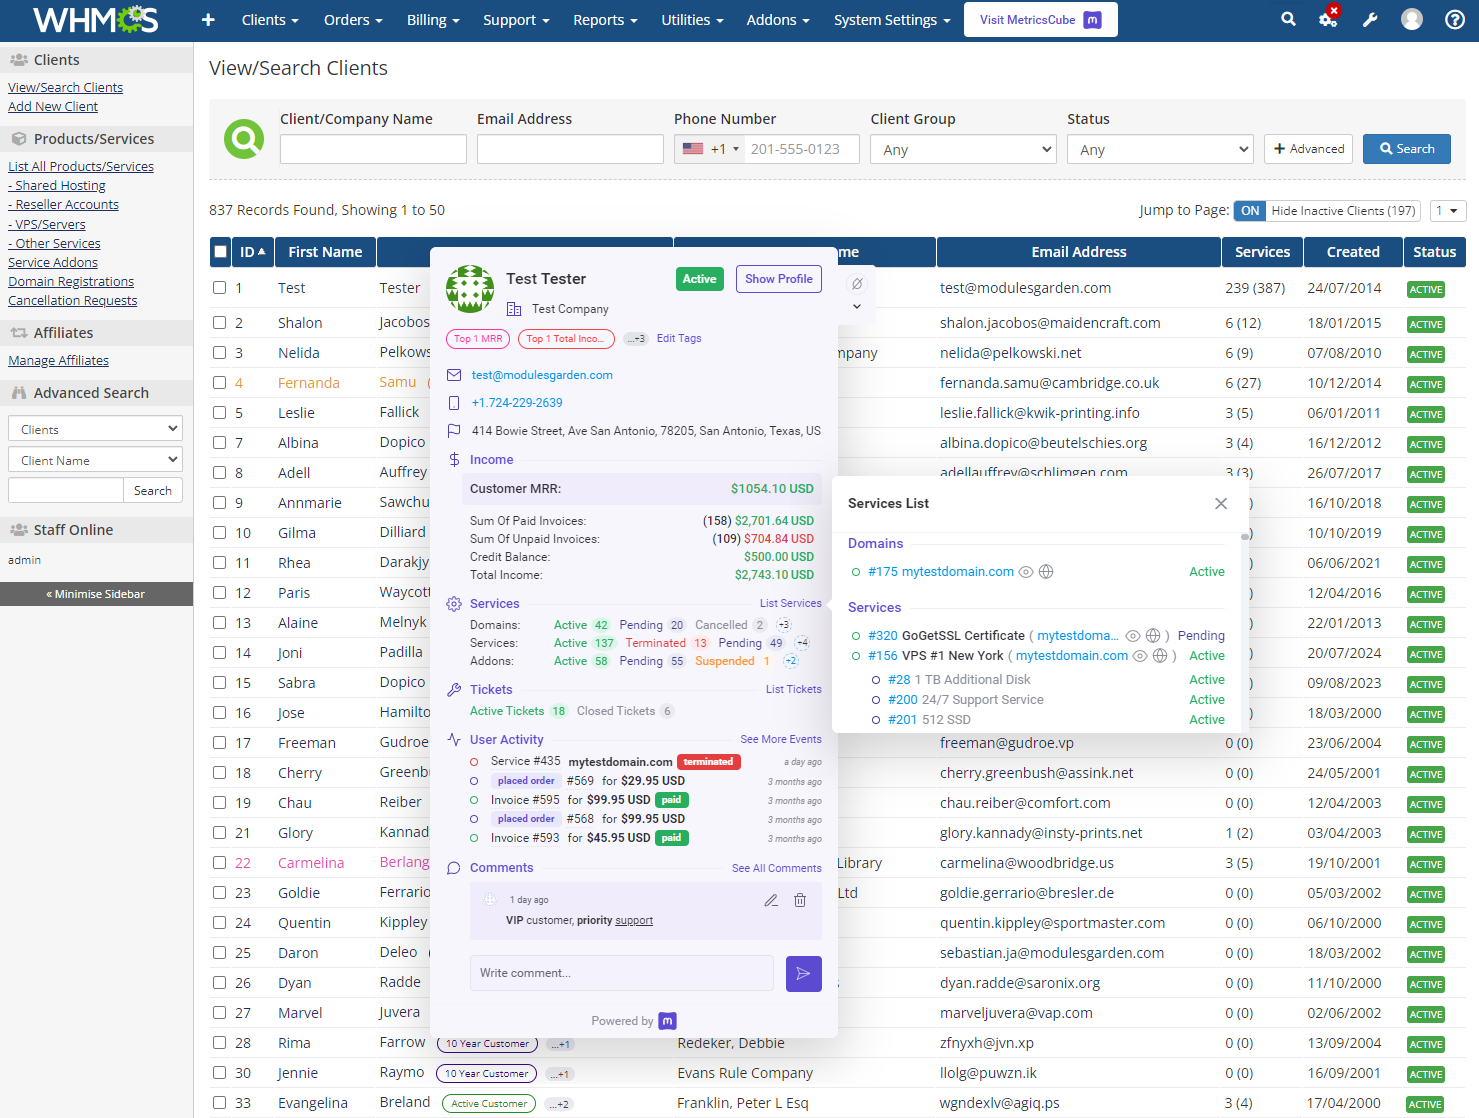
We couldn’t resist turning this new release into another chance to join forces with ModulesGarden, and we’re thrilled with the result! MetricsCube Connector For WHMCS has received a solid update too, and now offers full compatibility with both the latest MetricsCube features and WHMCS V8.12. And yes, it’s still free of charge!
But no MetricsCube update is complete without those small yet mighty improvements, and this time, too, you’ll spot them across the entire platform – from smoother navigation and cleaner visuals to more intuitive filters and enhanced export options. We’ve fine-tuned the way data behaves in reports, ensuring it’s easier to sort, filter, and analyze key figures, even when working with larger datasets.
In addition, we’ve polished the app’s mobile performance, adjusted user permissions for better clarity, and ensured that day-to-day workflows – like generating exports or digging into activity logs – are now faster and more efficient.
It’s all about perspective
Ultimately, running a hosting business – or any recurring revenue model – requires you to balance growth and sustainability. But without knowing where your business stands right now, it’s difficult to guide where it’s going next. Yet, too often, data ends up scattered, hard to link together, and even harder to translate into meaningful action.
That’s why the Performance Report was designed to offer more than just numbers – it’s here to provide context, uncover trends, and help you spot patterns that might otherwise stay hidden in fragmented spreadsheets. Combined with the many smaller refinements across MetricsCube, this update is here to support a smoother, clearer decision-making process – one where you can focus on insights, not obstacles.
