It has been barely a few weeks since MetricsCube first saw the light of day, and yet it feels almost like a few months to us – the guys behind the scenes of it all. But not because things have been progressing so slow. Quite the opposite – we receive so much insightful feedback from you that we really have had our hands full, turning most common requests into upcoming features.
Today we would like to present you top five improvements that we have managed to implement to MetricsCube so far through our combined efforts.
5 New Business Reports
To let you analyze your company’s activities with an even higher degree of precision and lay out more effective business strategies, we have added as much as 5 practical reports:
- Transactions Value – instantly view the total value of all your past transactions, additionally categorized by a gateway, client group and a country
- Services With Domain Ratio – monitor the percentage of services with active domains assigned to them
- Domains With Service Ratio – trace the percentage of domains with related active services
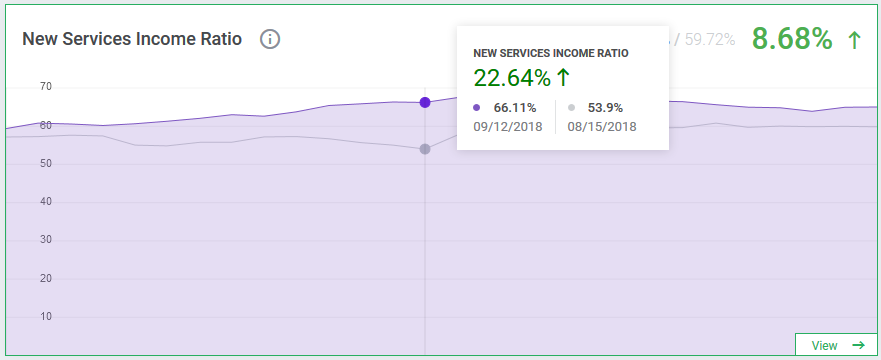
- New Services Income Ratio – learn what income your new services generated within the past 30 days when compared to the income of all services altogether
- New Domains Income Ratio – discover how much money you earned from new domains in the last 30 days in comparison to the income of all domains altogether
Multi-Branding Support
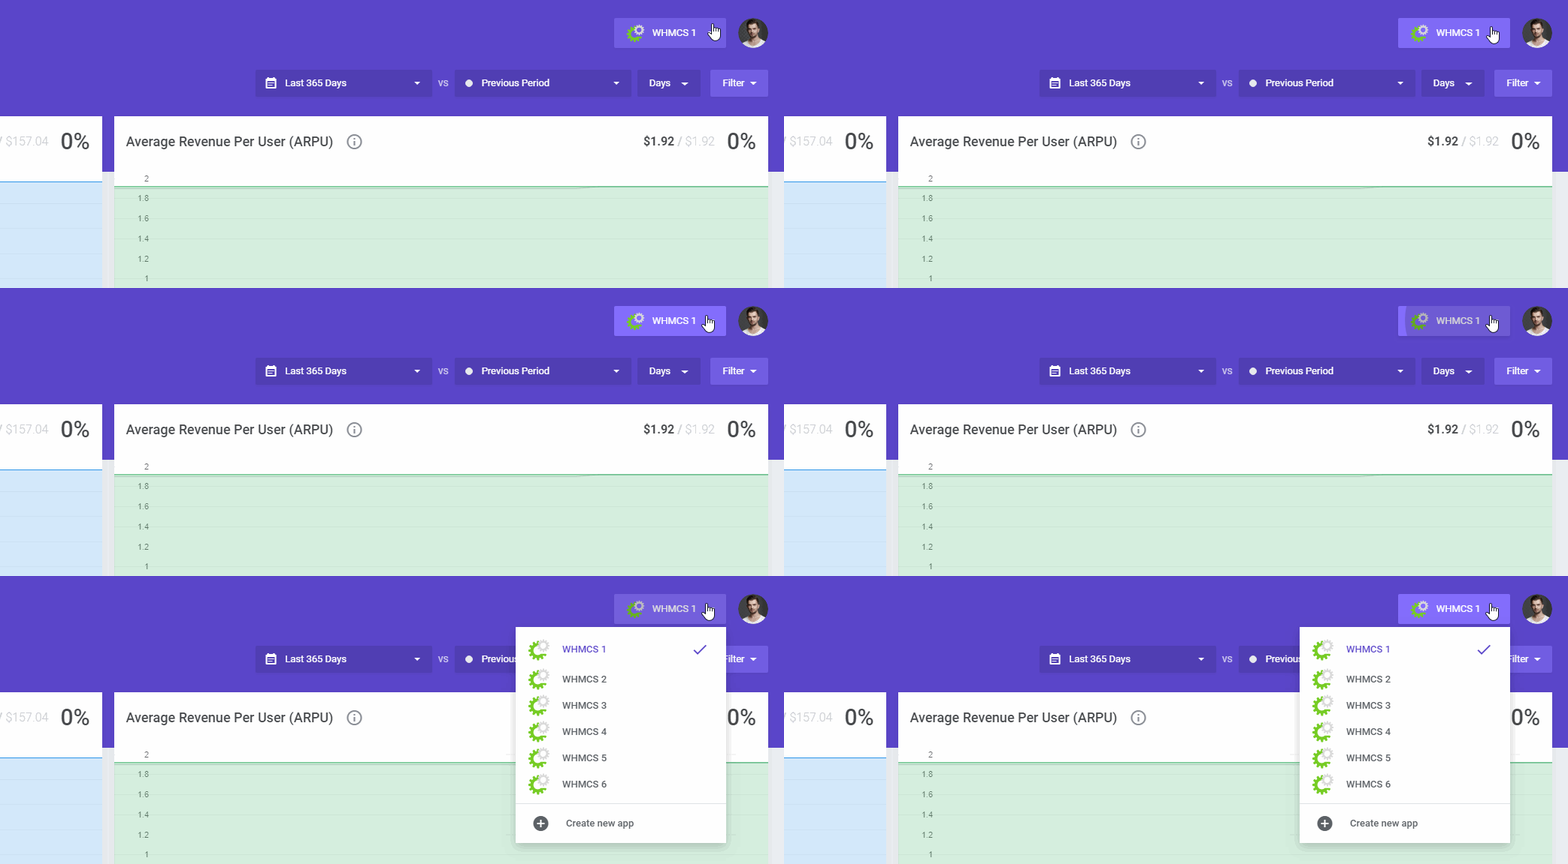
This feature has been implemented as a salute to those from our users who would love to synchronize multiple applications with MetricsCube via a single account. For example, if you own several WHMCS licenses dedicated to different brands, you can now manage each one of them separately from your MetricsCube dashboard, without the need to set up a new user account. Once we extend the list of supported applications with other planned integrations, you will be able to monitor their crucial details in a similar way.
Comparison & Filtering Powers United
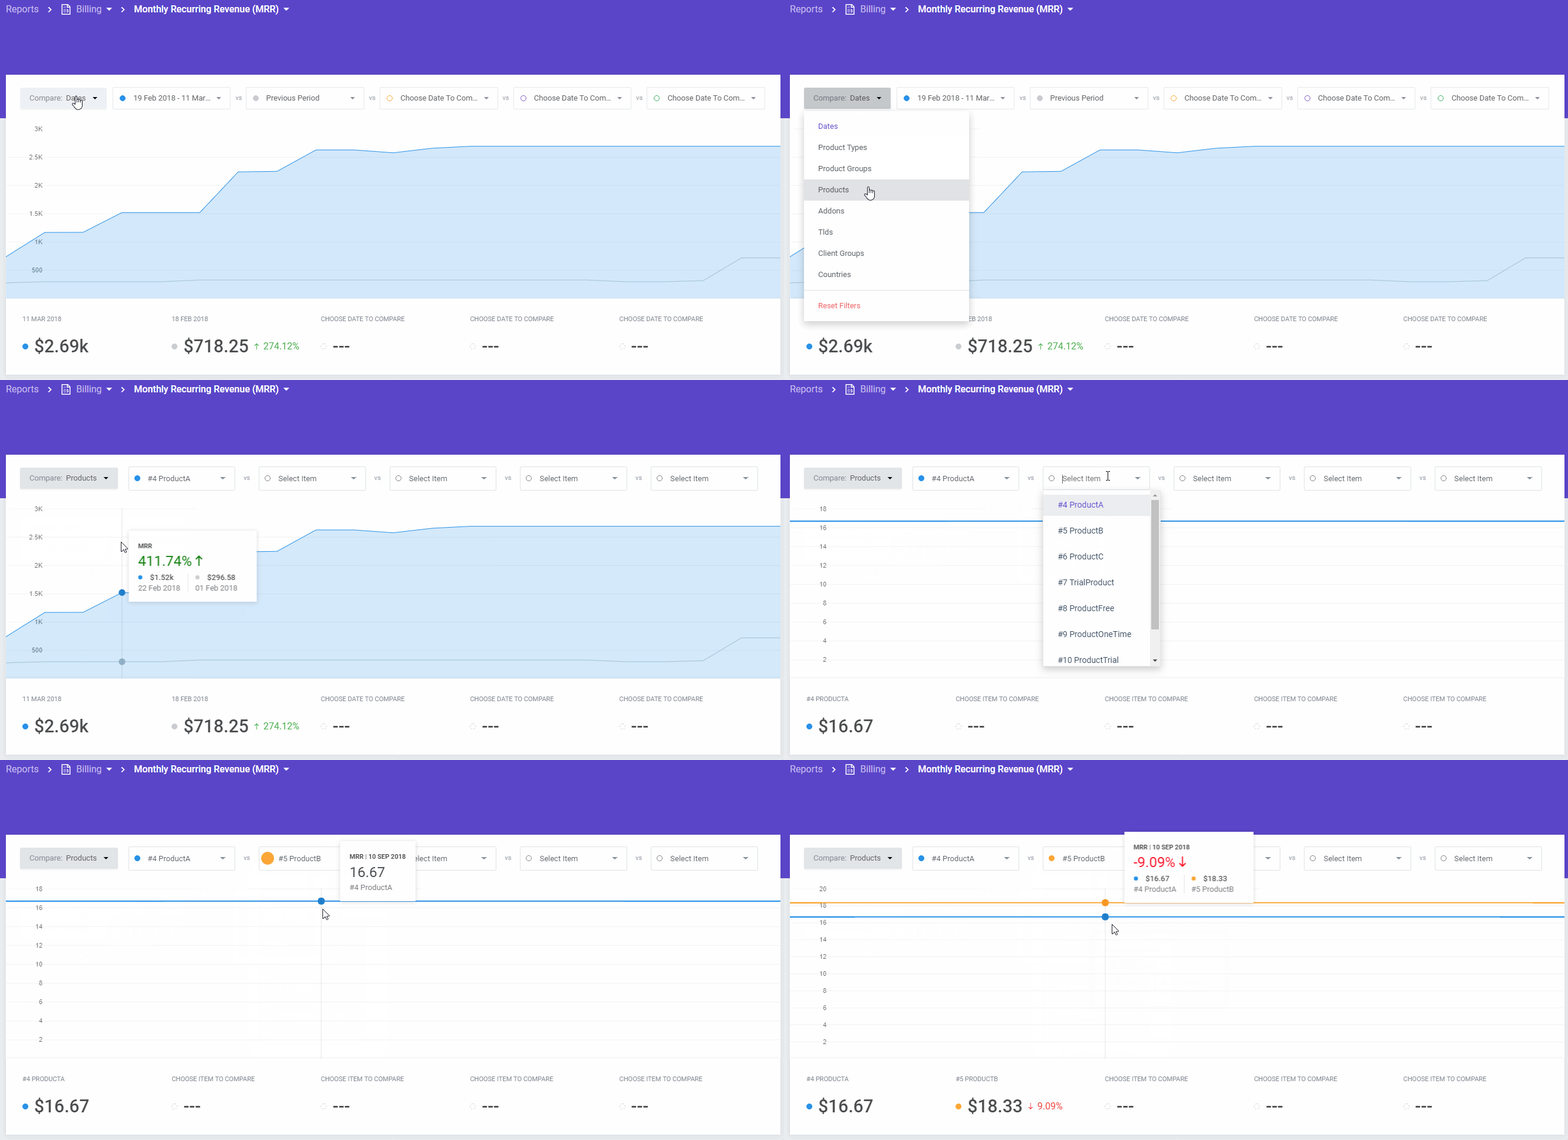
Up until now, MetricsCube users could easily look at each report from an even narrower perspective, by applying one of the many available filters or choosing customized time intervals to compare the data. To maximize the range of benefits you can derive from these two impactful mechanisms, we integrated their tools, so that you could apply both settings at the same time, for more accurate results. Eager to preview the MRR rate per a specific product, and then check if the value is higher now than two months ago? Go ahead!
Streamlined Calculation Processes
When running a dynamic enterprise, you need the assurance that the tool you are relying on for success keeps up with the pace. For this very reason we have introduced several major improvements to the way your key statistics are generated. MRR, ARPU, or LTV are but some of the reports that were covered by our optimization procedures. Rest assured that every number, every percentage indicated by your reports will be now right on target.
Numerous Essential Advancements
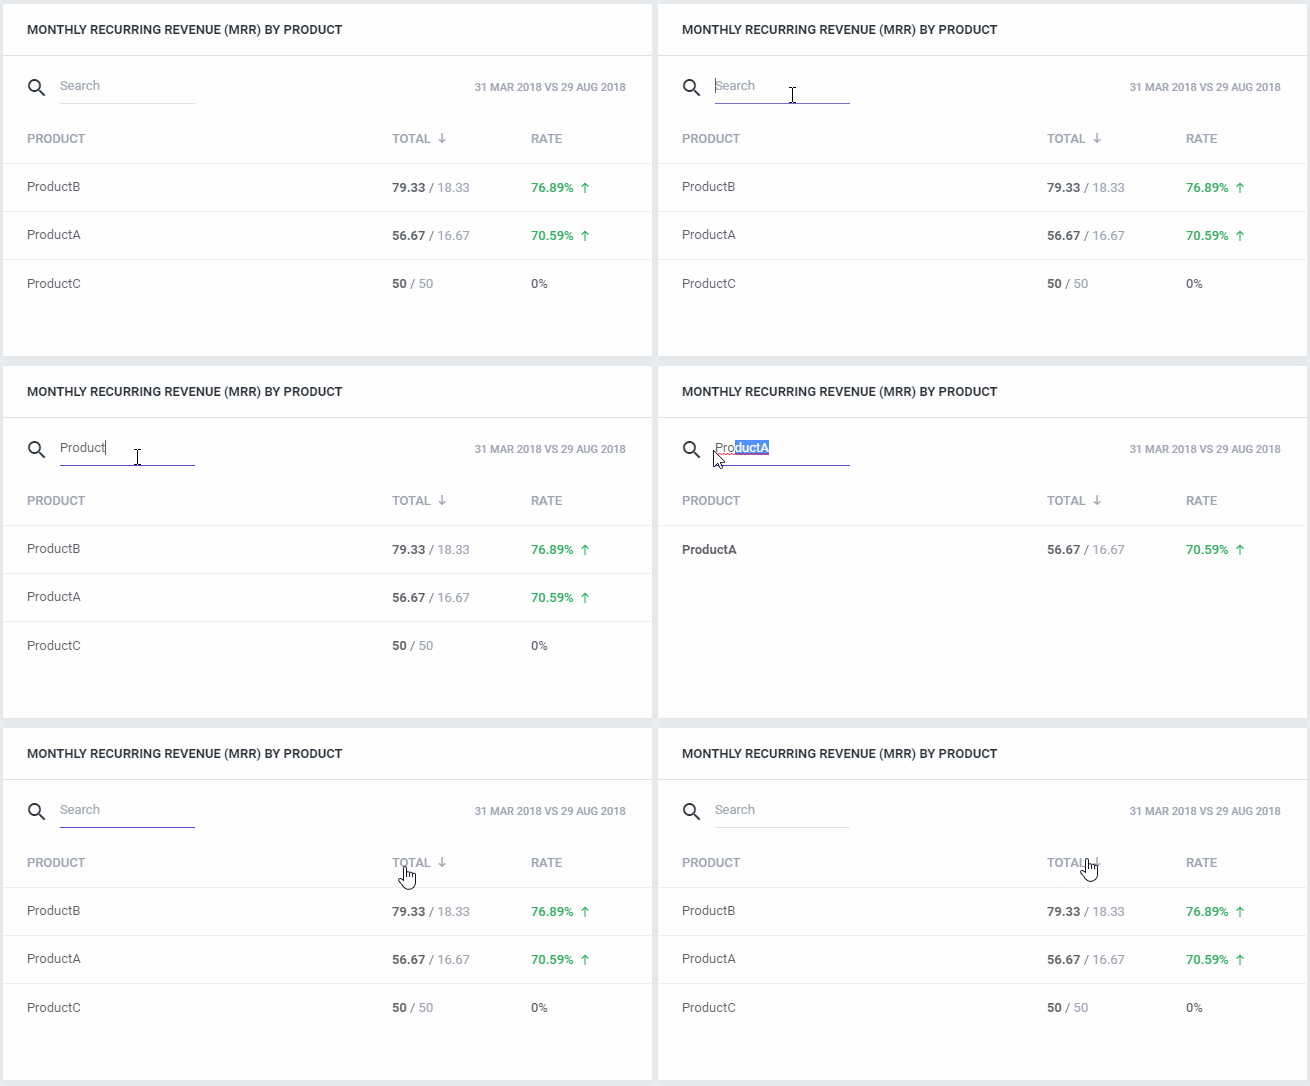
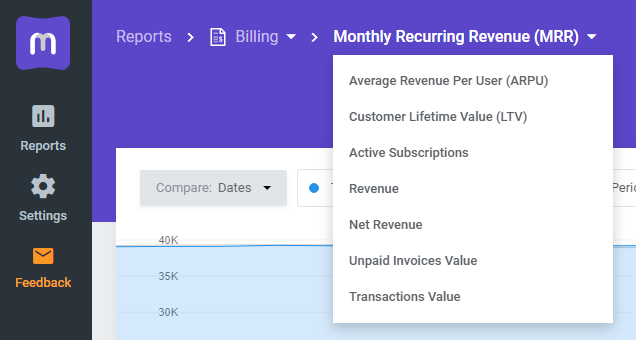
Given that MetricsCube is continuously under making, we are sparing no efforts to smuggle some tweaks and upgrades wherever we can. For instance, we have already managed to greatly improve data tables with quick search, sorting and rate, opened up a new opportunity to swiftly switch between various reports through the dropdown menu on report details page, and dealt with over 100 of most urgent issues.
The second best thing about MetricsCube – apart from the fact that it develops so fast thanks to your input – is that all the smallest changes made are updated live, which means you do not have to do anything but log in to your account and explore! No bulky updates, no waiting, just new possibilities ready for the taking immediately.
Would you like to help us make progress ten times faster? Do not forget to share your thoughts, which is super easy since you can do it directly from your dashboard – you are just a click away from accessing it!


